For PE-owned companies
See where the margin is in your business.
We turn your data and your people’s knowledge into a Margin Map: every opportunity sized by impact and ranked by how feasible it is for your team. Then we run the RFXs that capture it.
Contracts, spend, GL, AP and card data, taken as they are, plus interviews with your team. Our Opportunity Assessment (OA) takes a few weeks, and senior operators check every result before it reaches you. Your team makes the calls.
See where we’d look first. Thirty minutes.
01Why now? We’re doing fine.
Nobody missed anything. The world changed.
Owners need more margin, and the market no longer supplies it. Spend is the fastest lever to the bottom line: no capital, and no layoffs. What changed is that the margin in it can now be found.
Two things changed at once.
The need
Your owners need more EBITDA from every company they hold.
The means
AI now finds margin that was hidden or out of reach.
This wasn’t possible before. Every quarter you wait, that margin keeps leaking.
Your data
What we takeGL and AP, cleaned by finance
What we takeAll of it, as it is
ResultNothing left out
The analysis
Analyses runAbout 20, chosen up front*
Analyses runEvery one your data supports
ResultWhere nobody looked
The interviews
Who is askedA handful, one script
Who is askedMostly your own people, experts where needed
ResultWhat is feasible
Margin capture
What you getHanded over
What you getRFXs run with your team
ResultMargin on the P&L
*“About 20” is our estimate of a typical engagement.
02How does it work?
We map the margin in your business, then run the RFXs that capture it.
Three products, in sequence: the Enhanced Spend Cube, your data cleaned, normalized and categorized; the Opportunity Assessment, our main offer, which includes the Spend Cube and ends in the Margin Map; and RFX, run by our RFX team with yours. Two phases, seven steps. On every step, what your team does is the small part.
Phase 1 · Opportunity AssessmentMap the margin · a few weeks · Spend Cube included
- 1Data
Send it as it is. Cleaning and normalizing it is our first product: the Enhanced Spend Cube.
Your team: sends the data as it is
- 2Analysis
Every analysis your data supports, up to 175. Breadth nobody had time for.
Your team: nothing
- 3Interviews
AI-moderated, mostly with your own people; outside experts where a case needs one.
Your team: short interviews, when it suits
- 4Margin Map
Every opportunity by size and feasibility. Business cases and work plans.
Your team: go, not yet, or no
You get the Margin Map, business cases and work plans
Phase 2 · Margin captureCapture it, with your team
- 1Quick wins
Contract gaps, payment terms, risk. Fixes your team makes alone, from our script.
Your team: runs them
- 2RFX
The bigger opportunities, run by our RFX team: specs, vendor research, bids, negotiation prep.
Your team: decides, negotiates, signs
- 3Lasting change
Process, organization and systems, through a partner who does that work. Help picking software.
Your team: picks the path
You get margin on the P&L
We do the heavy lifting. Your team makes the calls.
03How does the OA find it?
Data tells half the story. People tell the other half.
The data
All of it, as it is. Every analysis it supports: breadth.
What’s possible
The people
Mostly your own people, AI-moderated: context.
What’s feasible
The Margin Map
big and feasible
The analysis brings breadth. Send it as it is. Cleaning and normalizing it is our first product: every rule written down, every number traceable to the invoice. Then we run every analysis your data supports, up to 175 across nine families. It shows where the money goes and how big each opportunity could be.
The interviews bring context. AI-moderated interviews, mostly with your own people (about 80%), and outside experts where a case needs one, each guide written from the analysis for that person. They confirm some opportunities, rule some out and surface new ones.
Where the two overlap is the Margin Map: what is big, and feasible for your team.
Why AI-moderated
Candid answers, and a guide written for each person.
What candid sounds like: in the Halden illustrative example, an engineer said one circuit board had come in higher, unchallenged. No ledger shows that.
A guide written for each person
Built around their role.
Candid answers
No interviewer to please, no boss in the room.
Taken when it suits them
No scheduling.
Follow-ups on what they say
The guide adapts as they answer.
Want the detail? See how the Assessment works, step by step, then and now →
04What does the OA produce?
The Margin Map. Every opportunity, by size and feasibility.
The last step of the Assessment. The closer an opportunity sits to the top right, the bigger and more feasible it is, and the higher its priority. Your team starts with the highest. Each opportunity worth doing comes with a business case and a work plan.
Sized by the data. Feasibility unknown.
- Found in the data
- Surfaced in the interviews
- Highest priority: where the team starts
- Illustrative placement: the Halden illustrative example.
The Halden illustrative example
Illustrative- revenue, a PE-owned device maker
- $300M
- revenue, a PE-owned device maker
- of supplier spend, never on one view
- $140M
- of supplier spend, never on one view
- buyers, and no contract calendar
- Four
- buyers, and no contract calendar
Why an OA: the owners asked for more EBITDA in next year’s plan, and the team had no time to look across $140M of spend.
After the interviews: nine preliminary business cases
$3.7M to $6.6M a year
Each with an owner inside the company. Estimated twelve-month range.
One example. The data showed five supplier names for circuit boards: in fact one supplier, one contract, and a cost-review clause never used. An engineer said one board had come in higher, unchallenged. The case grew.
05What does my team have to do?
We do the heavy lifting. Your team makes the calls.
Our team and AI do most of the work. Nobody leaves their day job.
Handled confidentially: NDA before anything moves.
06What happens after?
Margin capture: we run the RFXs with your team, and your team makes the calls.
Quick wins your team runs alone, from our script. RFXs our RFX team runs with yours: your team decides, negotiates and signs. Process, organization and systems change through a partner who does that work, and if none fits, a founder steps in. Help picking software when you need it. Nothing to install.
Margin capture · after the assessment
From the Margin Map to margin on the P&L. We do the heavy lifting.
- The OA, Margin Map: Every opportunity by size and feasibility, with business cases and work plans. Your team: go, not yet, or no. We: the Spend Cube, the analysis, the interviews and the map.
- Step 1, Quick wins: Contract-versus-actual gaps, payment terms, risk. Ready when the Assessment closes. Your team: runs them, on its own. We: the script, with the evidence for each fix.
- Step 2, RFX: The bigger opportunities from the Margin Map: specs, vendor research, bid comparison, negotiation prep. Nothing to buy or install. Your team: decides, negotiates, signs. We: our RFX team runs the RFX with yours.
- Step 3, Lasting change: Process, organization and systems change, through a partner who does that work. Help picking software when you need it. Your team: picks the path and the partner. We: bring a partner who fits; if none does, a founder steps in.
- Result, Captured margin: Margin on the P&L. On your P&L.
You get margin on the P&L.
07Who checks the work?
AI does the heavy lifting. People decide what stands.
We didn’t build a fully automated system, and wouldn’t trust one.
Every result passes quality checks, then senior operators, led by Jim and Trevor, keep, correct or cut it.
- 1
Flagged
The analysis
Every number traces back to the invoice.
- 2
Quality checks
Source data and interviews
Anything that doesn’t hold is flagged.
- 3
Senior judgment
A senior operator
Keeps, corrects or cuts every result.
Expedite premiums on inbound freight
Paid above the contract rate, load after load.
Price rise on a packaging supplier
Unit price up sharply in a year.
Illustrative findings.
08Who would we be working with?
The people who built it.

Jim Williams
Co-founder
- McKinsey & Company
- Kellogg
- Stanford
- UCLA
Fifteen years as a leader in McKinsey’s procurement practice.
LinkedIn: Jim Williams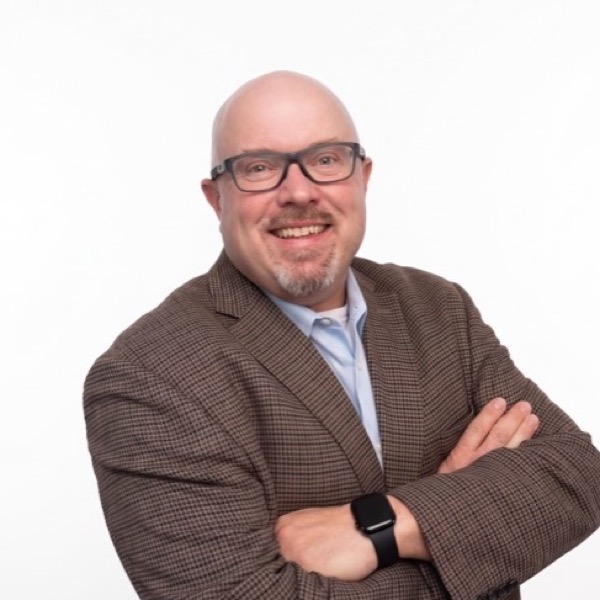
Trevor McCaw
Co-founder
- C-level PE operator
- BCG
- Harvard Business School
Former medical-device CEO and four-time founder.
LinkedIn: Trevor McCawOperating partners
Start with one portfolio company.
Tools that didn’t exist a year ago let us do this across your portfolio in a few weeks, without pulling your teams off their jobs. Introduce us to one CFO. We’ll show where we’d look, or tell you there isn’t enough there.
Deal partners
See the margin before you close.
OA Diligence is a light version of the Opportunity Assessment for deal teams. It reads the target’s spend from the data room and tests it with outside experts, with a range on every number. Your investment case shows where the margin is likely to sit.
Book
Thirty minutes with Trevor or Jim.
You leave knowing where we’d look first, or that there isn’t enough there.
Calendar not loading? Open it in a new tab or write to hello@procurevenn.com.